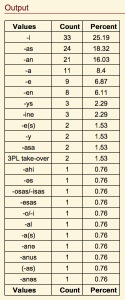
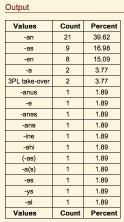
The Query Builder provides an additional interface for exploring hierarchies within data points. The Content Hierarchy function takes any number of user selected data points. The values of each selected Data Point are compiled into a single list of values with the count of samples that have that value in one of the selected Data Points and that figure as a percentage of the total is presented in the output table.
Before a hierarchy can be performed each of the Data Points that are to be used must have a label entered for them using Search Mode within the Browse section of RMS.
While in 'Search' mode enter a column label by entering a meaningful string into the search criteria box for the wanted data point. This string must start and end with a double quote ("); it is what defines it as a label rather than a search criterion.
Submit the label just like you would a search criterion by hitting 'Enter'. This must be done for each data point required as a column in the download file.
Once all search criteria and labels have been entered save the search.


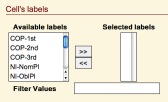
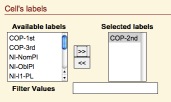
This interface provides a tool for selecting multiple 'labelled' Data Points. By selecting the label in the right hand select box ('Available Labels') and clicking on the button with the arrow pointing to the right, the label will move to the right hand select box ('Selected Labels').
Once a 'Label' is put into the 'Selected Labels' box the values for the Data Point that it represents will appear in the output table with thier counts and percentages.
Any number of labels can be added to the 'Selected Labels' tool. The vaues for each additional label will be added to the output table. Be careful not to add labels from completely unrelated Data Points as the resulting output will be meaningless.
Remve a label from the 'Selected Labels' tool by clicking on the label and then clicking on the button with the arrows pointing to th left. The label will be removed from the 'Selected Labels' tool and re-apear in the 'Available Labels' tool.
If the entire list of values is not needed in the output the 'Filter' tool can be used. Enter a Regular Expression into the filter tool and hit return. This will update the output table only presenting those values that match the entered regular expression.